


Java 래퍼(wrapper) 클래스 오토 박싱(auto boxing)과 성능 이슈
RECOMMEND POSTS BEFORE THIS
0. 들어가면서
성능 분석을 위해 사용한 모니터링 툴(tool)은 VisualVM을 사용했다. VisualVM에 Visual GC 플러그인(plugin)을 설치하여 가비지 컬렉션(Garvage Collection, GC)도 확인해보았다.
1. Test with auto boxing
기본형 타입의 멤버 변수를 지닌 SnoopInt 클래스를 살펴보자.
package blog.in.action.autoboxing;

public final class SnoopInt {

    final int id;

    SnoopInt(int id) {
        this.id = id;
    }

    int getId() {
        return id;
    }
}
다음은 Runnable 인터페이스를 구현한 MikeTyson 클래스를 살펴보자. MikeTyson 객체의 run 메소드를 보면 snoopIntCopy.getId() 메소드에서 반환한 primitive 타입의 int 값이 containsKey 메소드에 전달되면서 오토 박싱이 발생한다. 테스트를 위해 다음과 같은 main 메소드에 8개 데몬 스레드를 생성 후 작업을 시킨다.
package blog.in.action.autoboxing;

import java.util.Collection;
import java.util.HashMap;
import java.util.Map;

public final class MikeTyson implements Runnable {

    private final Map<Integer, SnoopInt> map = new HashMap<>();

    public MikeTyson() {
        for (int i = 0; i < 1_000_000; i++) {
            map.put(i, new SnoopInt(i));
        }
    }

    public void run() {
        long yieldCounter = 0;
        while (true) {
            Collection<SnoopInt> copyOfValues = map.values();
            for (SnoopInt snoopIntCopy : copyOfValues) {
                // containsKey 메서드 부분에서 오토 박싱(auto boxing) 발생
                if (!map.containsKey(snoopIntCopy.getId())) {
                    System.out.println("Now this is strange!");
                }
                if (++yieldCounter % 1000 == 0) {
                    System.out.println("Boxing and unboxing");
                }
                // yield 메서드를 수행하여 자신의 수행 시간을 다른 스레드에게 넘긴다.
                Thread.yield();
            }
        }
    }

    public static void main(String[] args) throws java.io.IOException {
        ThreadGroup threadGroup = new ThreadGroup("Workers");
        Thread[] threads = new Thread[8];
        for (int i = 0; i < threads.length; i++) {
            threads[i] = new Thread(threadGroup, new MikeTyson(), "Allocator Thread " + i);
            threads[i].setDaemon(true);
            threads[i].start();
        }
        System.out.print("Press to quit!");
        System.out.flush();
        System.in.read();
    }
}
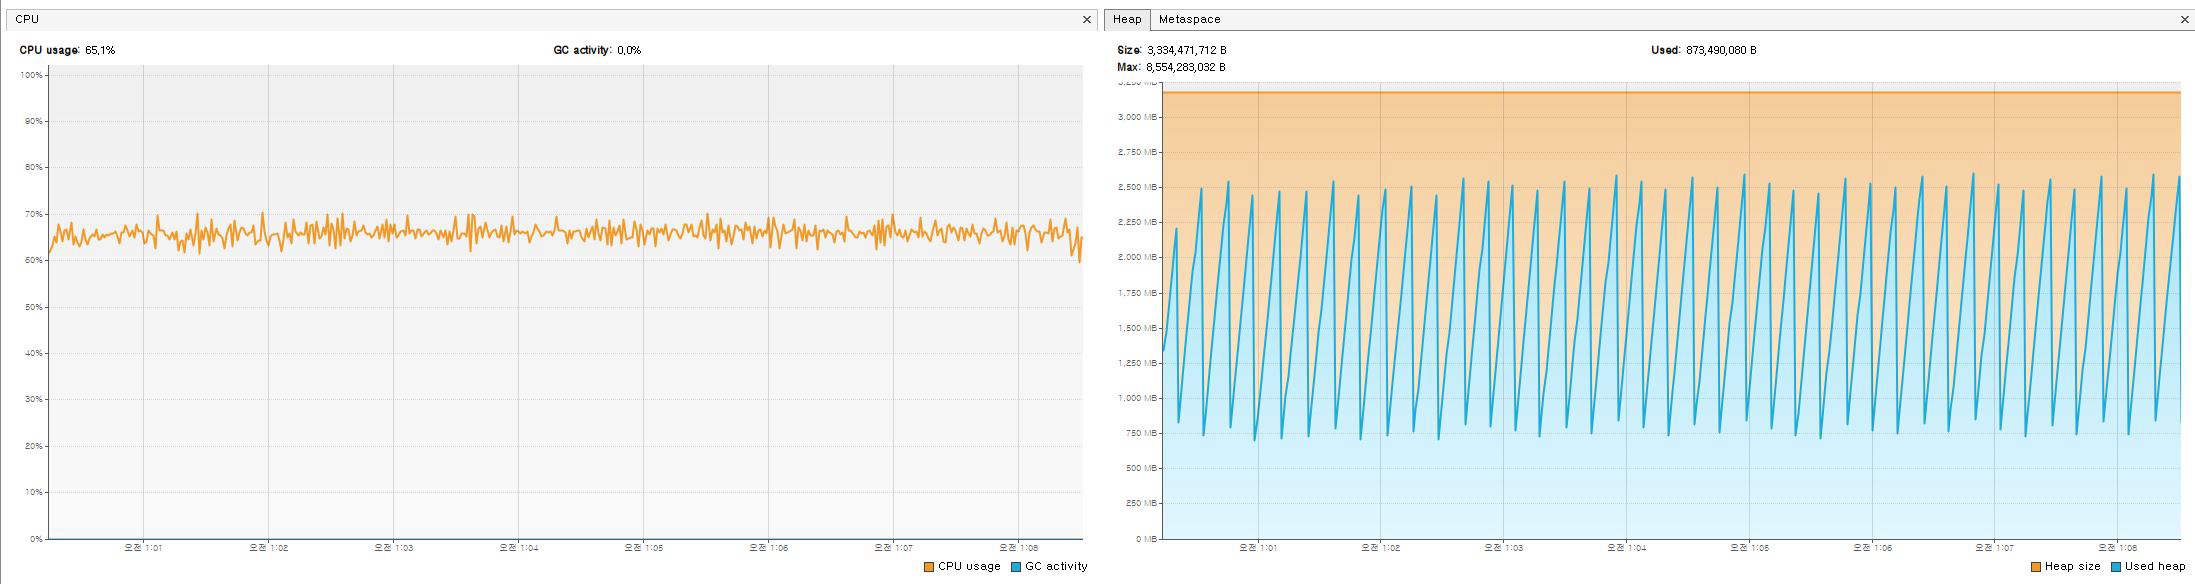
위에서 실행한 프로세스를 약 11분 동안 모니터링하였다. CPU / Heap 메모리 사용률에서 다음과 같은 결과를 확인할 수 있다.
- CPU 사용률은 크게 특이사항이 없다.
- Heap 메모리 사용률을 보면 3300MB의 75% 수준인 2500MB까지 사용률이 높아졌다가 떨어지는 것이 반복된다. Heap 사용률이 떨어지는 것은 GC(Garbage Collection, 가비지 컬렉션)가 발생한 것이다.
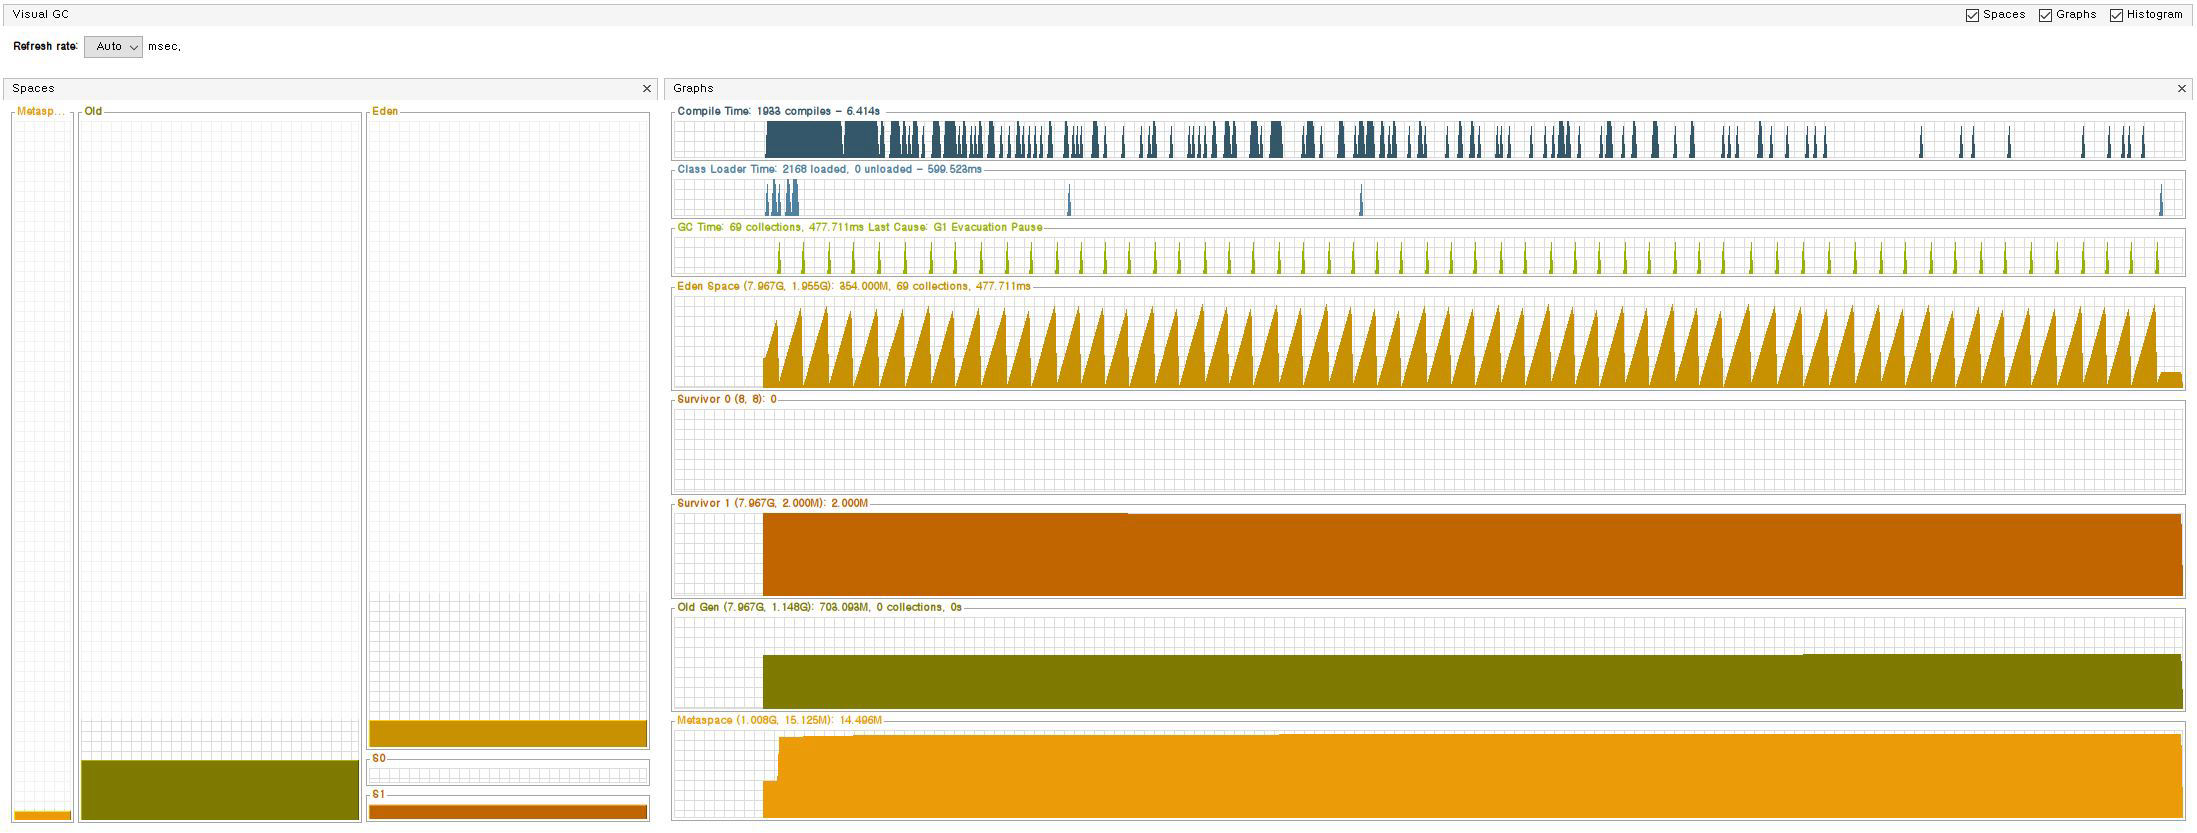
Visual GC 플러그인의 화면을 보면 객체가 처음 생성되면 위치하는 에덴(eden) 영역의 메모리가 높아졌다 떨어지는 것이 자주 반복된다. 에덴 영역의 메모리가 떨어지는 시점에 GC Time이 올라가는 것을 보아 가비지 컬렉션이 동작하였음을 확인할 수 있다.
2. Test Without auto boxing
성능 최적화 한 테스트 코드를 살펴보자. SnoopInt 클래스의 멤버 변수를 래퍼(wrapper) 클래스로 변경하여 이전 코드처럼 containsKey 메소드에서 오토 박싱이 발생하지 않도록 수정했다. SnoopInt 클래스는 아래처럼 래퍼 클래스 타입의 멤버 변수를 지닌 클래스이다.
package blog.in.action.autoboxing;

public final class OptimizationSnoopInt {

    final Integer id;

    OptimizationSnoopInt(Integer id) {
        this.id = id;
    }

    Integer getId() {
        return id;
    }
}
MikeTyson 클래스도 일부 변경이 필요하다. MikeTyson 생성자에서 맵(map) 객체를 준비할 때 Integer 클래스의 valueOf 메소드를 통해 래퍼 클래스 객체가 키에 포함되도록 한다. snoopIntCopy 객체의 getId 메서드를 통해 꺼낸 값은 이미 래퍼 클래스 객체이므로 containsKey 메서드 수행 시 오토 박싱이 발생하지 않는다. 기타 다른 나머지 동작들은 동일하다.
package blog.in.action.autoboxing;

import java.util.Collection;
import java.util.HashMap;
import java.util.Map;

public final class MikeTyson implements Runnable {

    private final Map<Integer, OptimizationSnoopInt> map = new HashMap<>();

    public MikeTyson() {
        for (int i = 0; i < 1_000_000; i++) {
            map.put(Integer.valueOf(i), new OptimizationSnoopInt(Integer.valueOf(i)));
        }
    }

    public void run() {
        long yieldCounter = 0;
        while (true) {
            Collection<OptimizationSnoopInt> copyOfValues = map.values();
            for (OptimizationSnoopInt snoopIntCopy : copyOfValues) {
                if (!map.containsKey(snoopIntCopy.getId())) {
                    System.out.println("Now this is strange!");
                }
                if (++yieldCounter % 1000 == 0) {
                    System.out.println("Boxing and unboxing");
                }
                Thread.yield();
            }
        }
    }

    public static void main(String[] args) throws java.io.IOException {
        ThreadGroup threadGroup = new ThreadGroup("Workers");
        Thread[] threads = new Thread[8];
        for (int i = 0; i < threads.length; i++) {
            threads[i] = new Thread(threadGroup, new MikeTyson(), "Allocator Thread " + i);
            threads[i].setDaemon(true);
            threads[i].start();
        }
        System.out.print("Press to quit!");
        System.out.flush();
        System.in.read();
    }
}
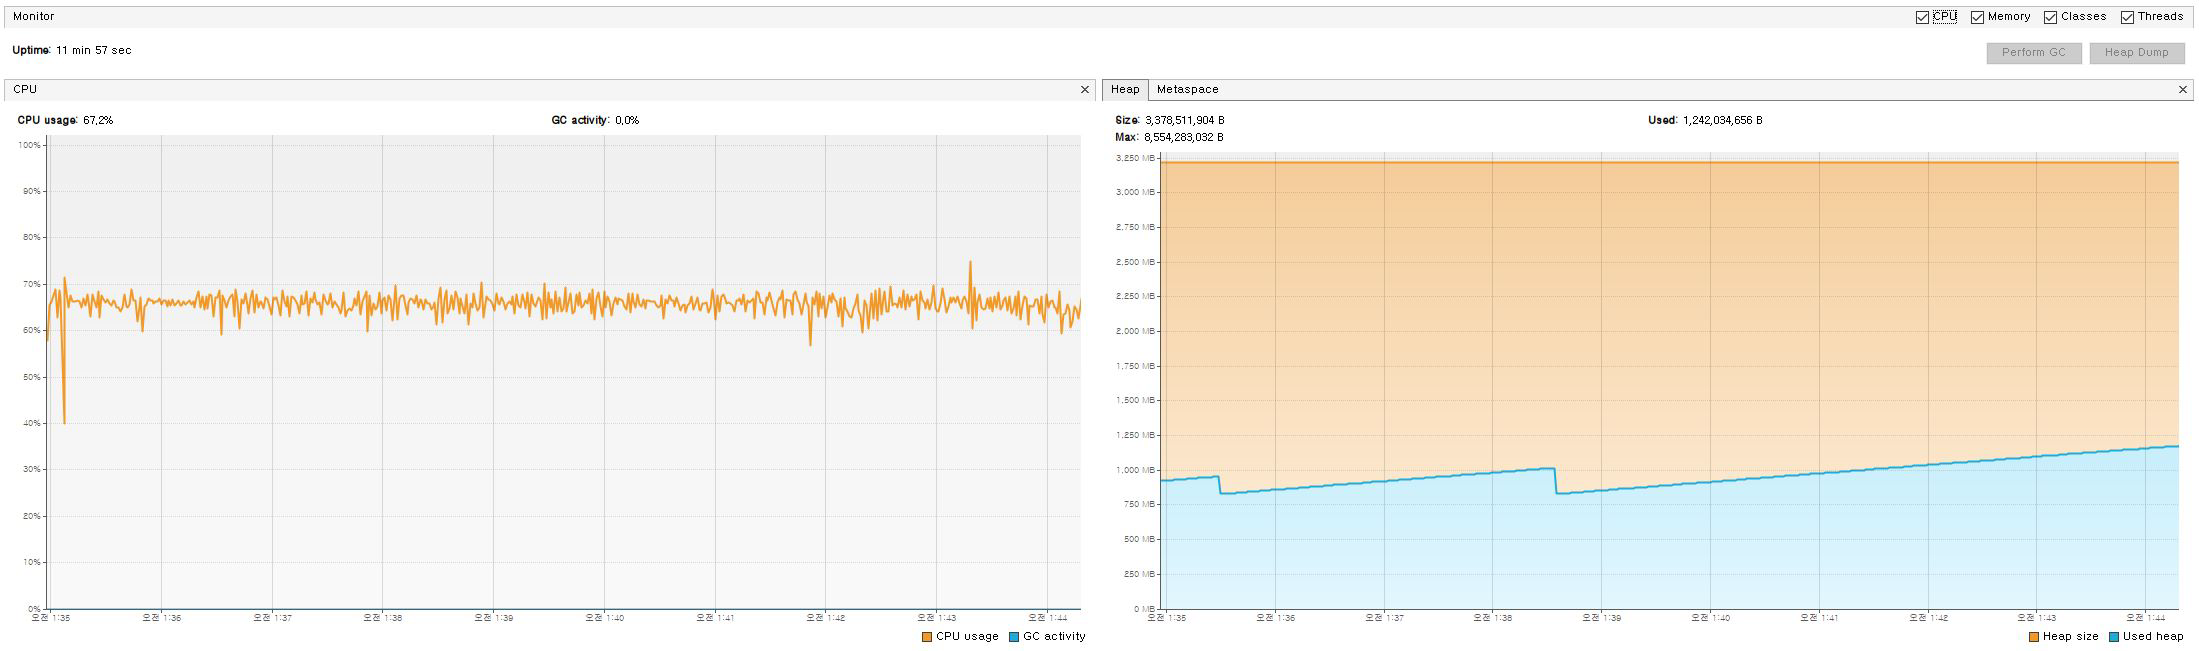
오토 박싱 테스트와 동일하게 11분 동안 모니터링하였다. CPU / Heap 메모리 사용률에서 다음과 같은 결과를 확인할 수 있다.
- 원인은 불명이지만, CPU 사용률이 크게 감소하는 지점이 있었다.
- Heap 메모리 사용률을 보면 3700MB의 33% 수준인 1250MB까지 사용률이 높아졌다 감소한다.
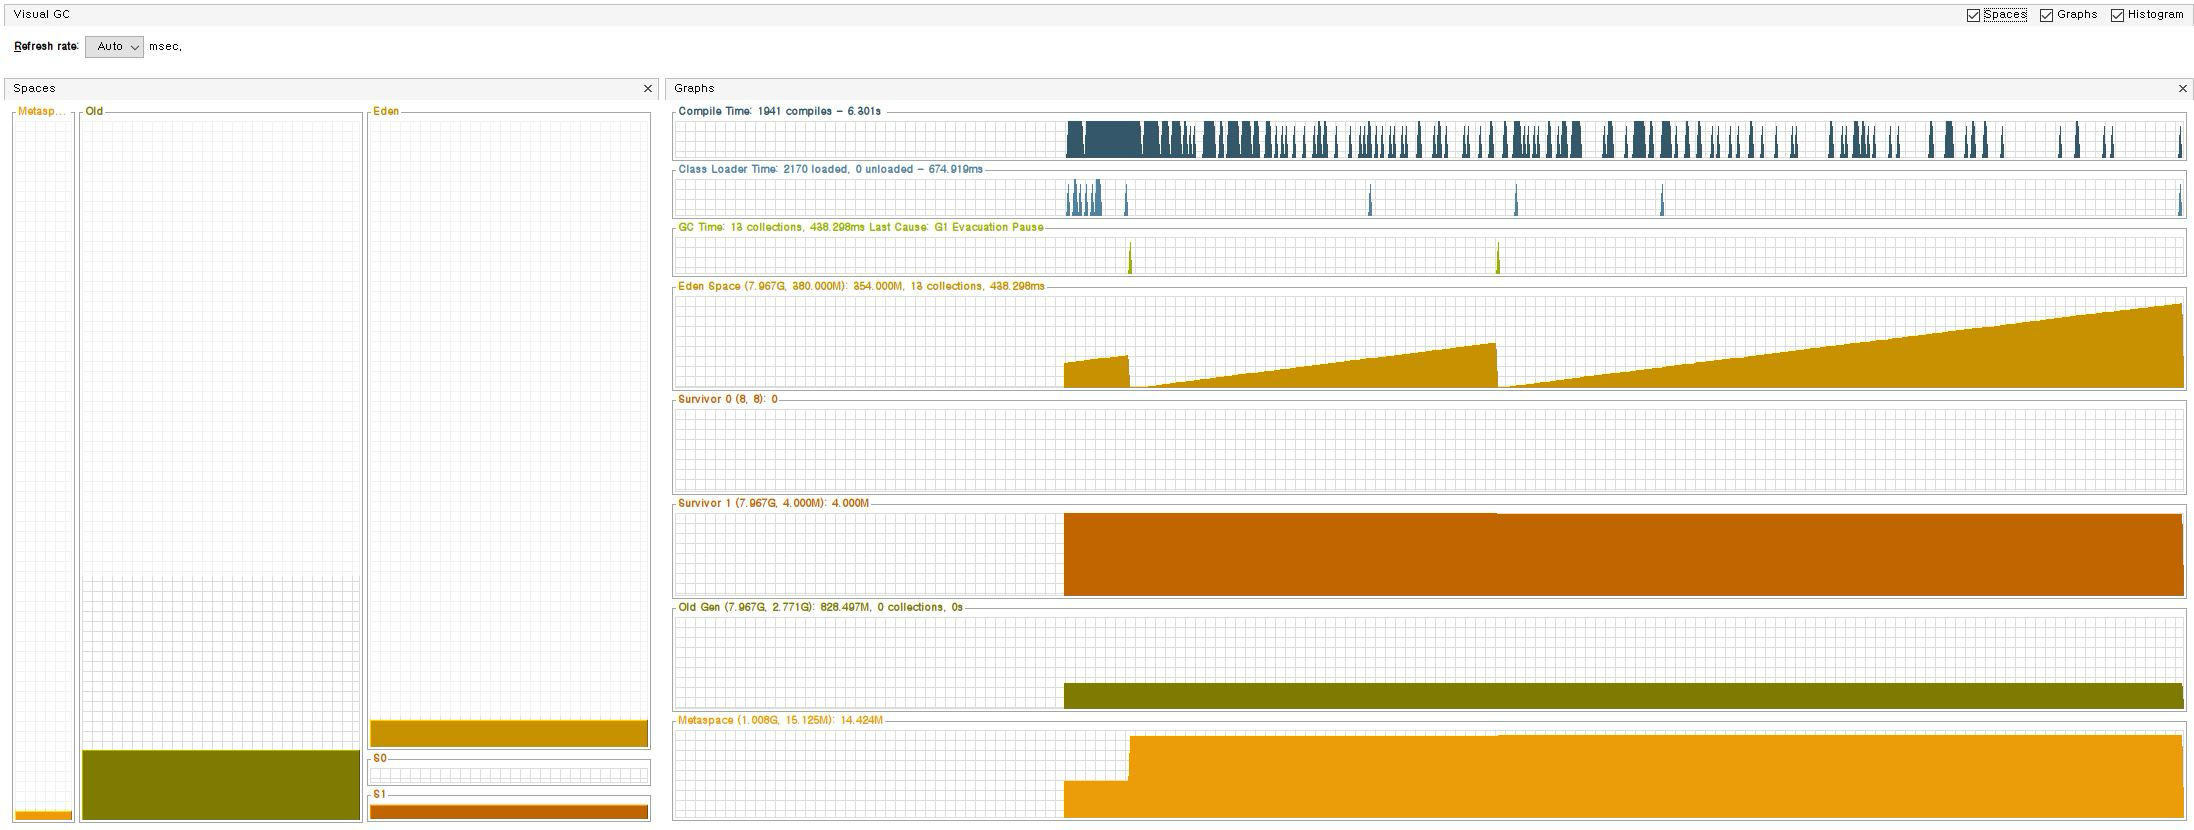
오토 박싱 테스트에 비해 가비지 컬렉션 수행 빈도 수가 현저히 적은 것을 확인할 수 있다. 이번엔 Visual GC 모니터링 화면을 살펴보자.
- 에덴 영역의 메모리가 높아졌다 떨어지는 주기가 매우 길다.
- 오토 박싱 테스트에 비해 가비지 컬렉션 수행 빈도 수가 매우 적다.
CLOSING
참고한 글을 보면 가비지 컬렉션은 시스템이 일순 멈추는 치명적인 문제가 발생한다. 그러므로 최대한 가비지 컬렉션 빈도를 줄이기 위한 노력이 필요하다.
Naver - Java Garbage Collection
GC에 대해서 알아보기 전에 알아야 할 용어가 있다. 바로stop-the-world이다.stop-the-world란, GC을 실행하기 위해 JVM이 애플리케이션 실행을 멈추는 것이다. stop-the-world가 발생하면 GC를 실행하는 쓰레드를 제외한 나머지 쓰레드는 모두 작업을 멈춘다. GC 작업을 완료한 이후에야 중단했던 작업을 다시 시작한다. 어떤 GC 알고리즘을 사용하더라도 stop-the-world는 발생한다. 대개의 경우 GC 튜닝이란 이 stop-the-world 시간을 줄이는 것이다.
댓글남기기